· 16 min read
How to Read a Sectional Chart: Step-by-Step for Pilots
How to read a sectional chart step by step: scale, airspace, terrain, obstructions and chart currency, with examples for PPL and IFR pilots.
You unfold the sectional on the kitchen table and the page looks less like a map than a collision between a road atlas and a weather chart. Blue rings, magenta shading, dashed boundaries, tiny numbers, a compass rose, abbreviations everywhere. You can find your home airport without trouble. You're less confident about anything drawn around it.
That reaction doesn't mean you're behind. A sectional carries five layers at once: ground, airports, airspace, obstructions and radio data. Nothing on the sheet tells you which layer to read first, so most students latch onto whichever symbol catches the eye and skip the one that decides the leg.
What follows is the sequence I walk students through at the table, in the same order I'd have them use it in the airplane. It's an order of reading, plus a currency check, because a symbol you recognize on a stale chart is worse than a symbol you have to look up.
Table of Contents
- Read Any Sectional in Five Passes
- Check Chart Currency Before Every Flight
- Turn Chart Inches Into Nautical Miles
- Airspace, Airports and Special Use Areas
- Terrain, Elevations and Obstructions on Your Route
- Practice Reading Charts Before Your Written Exam
Read Any Sectional in Five Passes
A route from one airport to another can cross a patchwork of terrain, airspace and radio requirements. Read the chart in a fixed order, and you're less likely to miss a layer while focusing on an easy-to-spot airport symbol.
Why the order matters more than the symbols
Use five passes for each planning session:
- Check the chart edition and effective date. The date tells you which version you're reading. Check it before interpreting any symbols.
- Read the scale and coverage. The scale lets you measure distance; the coverage shows where the chart ends and the next one begins. Without both, a route measurement may be misleading.
- Trace the route and scan either side of it. Note terrain, obstructions, airports and navigation aids. These features help you assess the ground below and the altitudes your route may require.
- Identify every airspace boundary the route crosses. Read the floor and ceiling as well as the lateral boundary. A line on the chart shows where airspace lies horizontally; its altitude limits tell you whether your planned altitude falls within it.
- Check frequencies, altitudes and special-use status. Match each frequency to its label, and check the published times for special-use areas before treating them as active or inactive.
Keep the order consistent, but read the chart as a set of connected layers. Terrain and obstructions inform your altitude choice; airspace limits and radio requirements then help you plan how to fly the route. For another chart-reading example, see this guide to low enroute chart symbols.
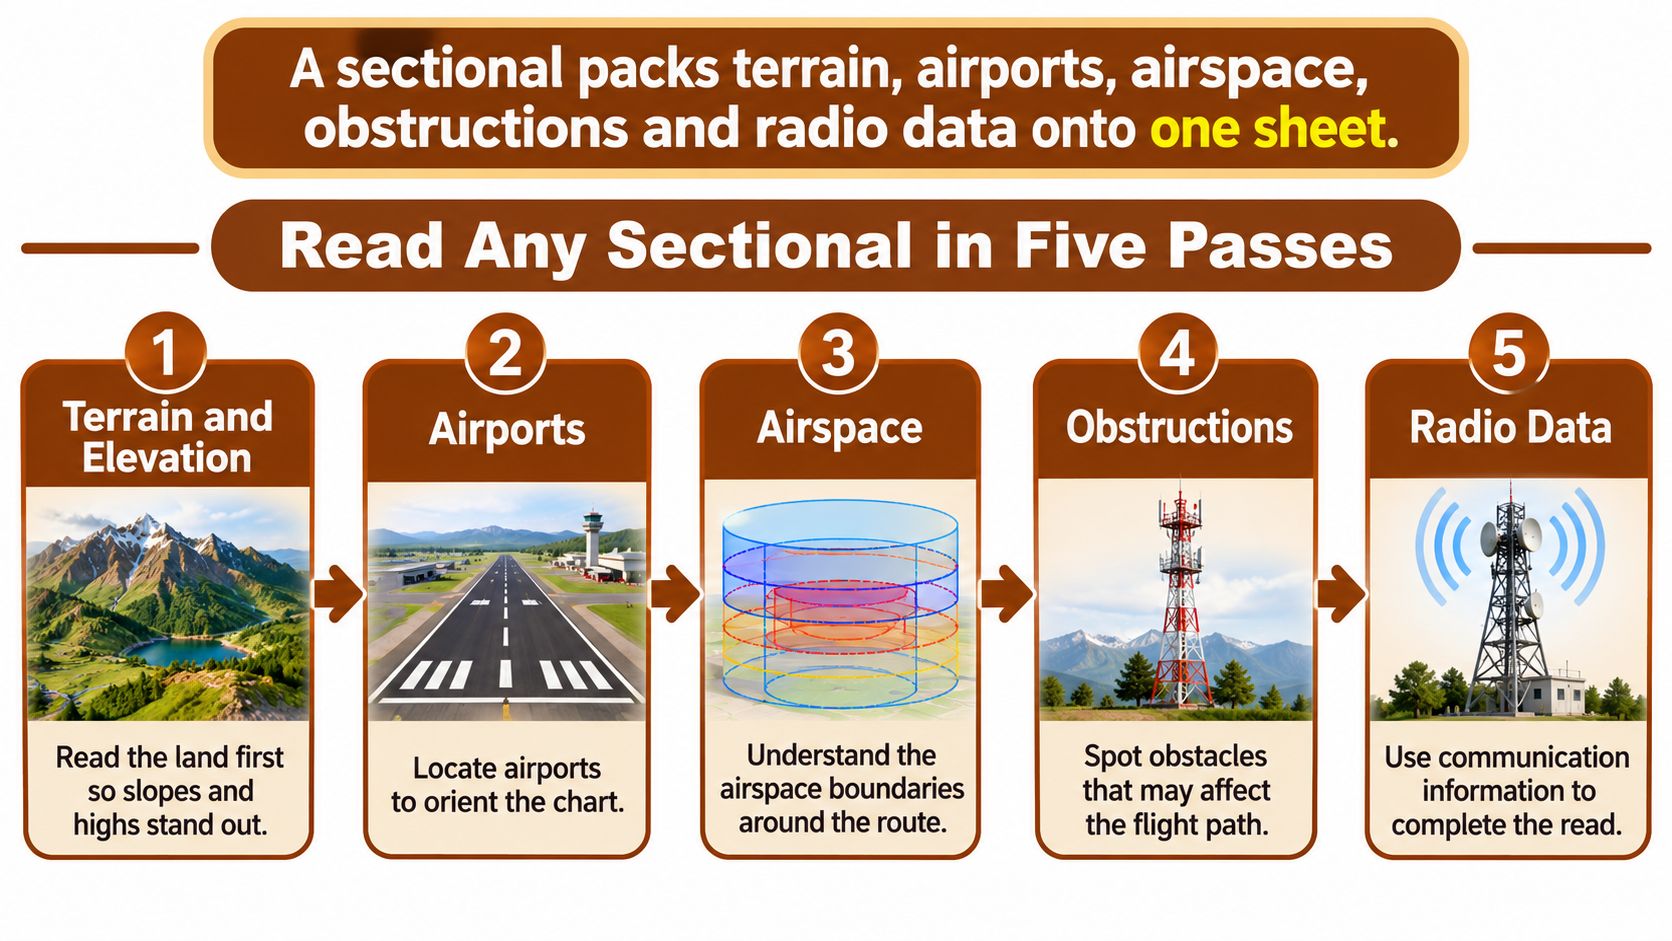
Ask four questions about each leg: What's below me? What airspace am I entering? What limits my altitude? What radio contact or clearance applies?
Answer each question for every segment, not just the route as a whole. A leg can pass over rising terrain, enter a different airspace shelf and require a new radio frequency. A chart may look fully reviewed even when one of those answers is missing.
Check Chart Currency Before Every Flight
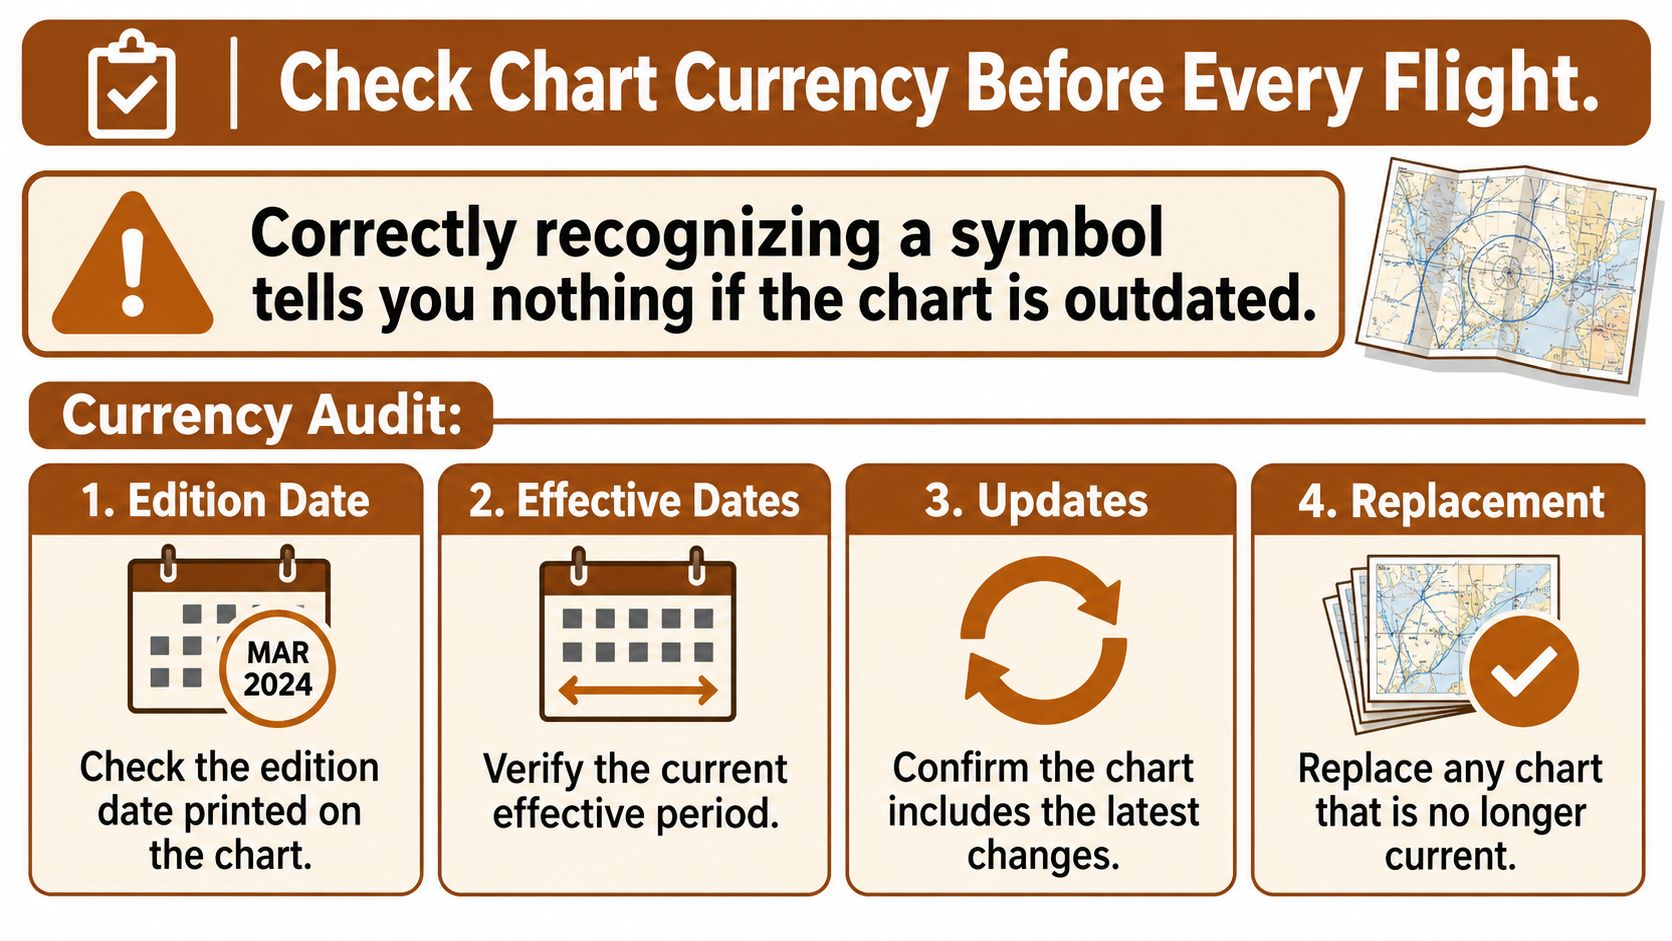
A pilot can identify every symbol on the page and still fly a leg that isn't legal. Recognizing a mark tells you what the chart said the day it was printed. It says nothing about whether that information is still true, and the gap between those two things is where false confidence lives.
The FAA maintains visual chart information on a 56-day cycle, and its guidance warns that although most sectionals are printed every six months, a chart more than eight weeks old may no longer be current (FAA VFR chart updates). That single line turns chart reading into a version-control job, and version control is where tablet cockpits get sloppy.
A currency audit takes about five minutes and covers four moves.
The audit, in order
- Read the edition date printed on the chart itself. Not the date your app displays, not the date you downloaded the file. The chart carries its own edition and effective date on the cover or margin.
- Check that edition against the cycle currently in effect. Your route may have been current last month and isn't now, and nothing on the page will announce the change.
- Scan the FAA chart updates for your area. New airports, changed frequencies and revised airspace appear there first, and those are the changes most likely to catch a student who only re-reads familiar symbols.
- Cross-check the Chart Supplement entry for every airport you might use. Runway data, frequencies and remarks live there, and the entry is the fastest way to catch a chart that has aged.
- Read the NOTAMs. Closed runways, temporary restrictions and last-minute changes can't appear on a printed sheet at all.
One failure that looks entirely normal
Say your tablet holds a cached copy of the chart from the spring, and the field you're diverting to has since changed its tower frequency. You brief the old number, dial it in, and get nothing while the airplane keeps drifting toward the pattern. The Chart Supplement entry lists the new frequency. Nothing on the chart looked wrong, because nothing on the chart was wrong when it was printed.
The habits that prevent this are boring and they work: one edition per flight, downloaded files labeled with their effective date, screenshots of older editions deleted rather than saved for convenience. If you keep three copies of a chart, you'll eventually brief the wrong one.
Before every flight, in this order: edition date, current cycle, chart updates for the route, Chart Supplement entry for each airport you might use, then NOTAMs.
Turn Chart Inches Into Nautical Miles
Say the leg between two checkpoints measures 3 inches on your sectional. On the ground that's about 20.6 nautical miles before you account for wind, deviation or the width of your pencil line. Students often guess "a bit less than that" from the spacing of the symbols. The chart has a number for it, and guessing is unnecessary.
The reason is the scale. The FAA specifies a standard sectional scale of 1:500,000, meaning one unit of distance on the chart represents 500,000 of the same units on the ground, and in practical terms 1 inch on the chart equals about 6.86 nautical miles (FAA Chart Users' Guide). That relationship is what lets you plan groundspeed, fuel range and time between checkpoints.
A sectional isn't a road map, either. It compresses terrain contours, shaded relief, drainage and visual landmarks together with airports, navigation aids, controlled airspace and obstructions. That density is why you measure deliberately and read the legend rather than inferring meaning from color.
| Measured on chart | Ground distance (NM) | Planning example |
|---|---|---|
| 1 inch | 6.86 | Short hop between two nearby checkpoints |
| 3 inches | 20.6 | A typical segment of a cross-country leg |
| 5 inches | 34.3 | Roughly half an hour at a 70-knot groundspeed |
| 10 inches | 68.6 | About an hour at the same groundspeed |
Measuring without guessing
Use a plotter against the chart's nautical-mile scale, or use the latitude and longitude tick marks along the border to confirm position before you trust a measurement. Measure from the center of each checkpoint, not the edge of the airport symbol, because the symbol itself covers ground. Then walk the plotter along the whole route in segments rather than measuring one straight line and calling it the distance.
- Check your units. Mileage on a sectional is nautical, and radials are magnetic. A statute-mile answer will make your fuel math wrong in the safe-looking direction.
- Convert distance to time deliberately. Divide the leg length by planned groundspeed. A 100-nautical-mile leg at 100 knots is an hour, and the same leg at 120 knots is fifty minutes.
- Re-measure any leg that changes. A reroute around airspace or terrain adds miles, and it adds them at the end of the flight when fuel matters.
For practice this week, take the last cross-country leg you flew and measure it with a plotter. Compare your answer to the GPS distance. When the two disagree by more than a couple of miles, you'll usually find you measured from a symbol edge or skipped a bend in the route.
Airspace, Airports and Special Use Areas
The first genuine confusion most students hit is that blue and magenta airport symbols look almost identical on a busy chart. They aren't the same thing at all, and the difference decides whether you need to talk to anyone before you arrive.
A blue airport symbol marks a field with an operating control tower, so two-way radio contact is part of getting in. A magenta airport symbol marks a non-towered field, where you check the Chart Supplement for the common traffic advisory frequency and announce your position yourself.
Airspace in the order a route meets it
- Class B shows as solid blue lines with altitude steps around busy hubs and needs a clearance before entry. The steps are the part students miss, because the outer shelf can sit over your route while the inner ring doesn't.
- Class C shows as solid magenta lines with altitude steps and needs two-way radio contact before entry.
- Class D shows as dashed blue lines around a towered airport and needs two-way radio contact before entry.
- Class E surface areas show as dashed magenta lines. Read the floor and the ceiling; Class E is where assumptions cost people the most.
- Class G has no boundary drawn at all, which is exactly why it's easy to overlook when you're scanning for lines.
| Element | How it appears on the chart | What it requires |
|---|---|---|
| Class B airspace | Solid blue lines with altitude steps | Clearance from ATC before entry |
| Class C airspace | Solid magenta lines with altitude steps | Two-way radio contact before entry |
| Class D airspace | Dashed blue lines around the airport | Two-way radio contact before entry |
| Class E surface area | Dashed magenta lines | Check floor and ceiling; ATC contact as the class requires |
| Class G airspace | No boundary drawn | Uncontrolled; no clearance needed |
| Restricted area (R) | Blue hatched boundary labelled R | Permission required; check active times |
| Prohibited area (P) | Blue hatched boundary labelled P | Flight not permitted |
| Airport with control tower | Blue airport symbol | Radio contact before entering airspace |
| Airport without control tower | Magenta airport symbol | Use the CTAF frequency from the Chart Supplement |
Special use areas, decoded
Restricted and prohibited areas carry an R or a P on the chart, and you check their active times before you plan through or near them. A restricted area isn't permanently hot, and a prohibited area doesn't become available because you're only clipping the corner.
A military operations area has a magenta hatched border. VFR flight isn't prohibited, but military activity may be running inside, so check the charted hours and altitudes. A warning area uses a blue hatched border and gets the same check, typically offshore. An alert area has a magenta hatched border and marks a high volume of pilot training. The hatch alone never tells you an area is closed or active.
A practical rule I give every student: read the most restrictive boundary first, then work outward. A prohibited area outranks a Class D shelf, and the Class D shelf outranks a boundary you're only brushing.
That order matters on a real leg. Say you plan a 1,500-foot cruise that runs along the edge of a Class D shelf near a towered field. The lateral boundary tells you nothing useful until you've read its altitude limits and confirmed where the shelf begins vertically. If the shelf reaches down to your altitude, the leg as drawn isn't legal, and the chart said so before you ever started the engine.
If the boundary colors still blur together when you look at a full chart, work through airspace classifications explained before your next planning session, then come back and trace a real route.
Terrain, Elevations and Obstructions on Your Route
Start with the general picture rather than a single symbol. Brown contour lines and shaded relief tell you whether the route climbs toward higher ground or runs across forgiving terrain, and that answer shapes every altitude decision that follows.
Read the altitude information in a fixed order: terrain shading and contours first, then the highest published elevation in the operating area, then each obstruction symbol and its height, then your planned cruise altitude against the cloud-clearance rules that apply. The FAA Aeronautical Chart Users' Guide treats legend consultation as a required technical step, not optional background reading. Sectionals also depict only airspace effective below 18,000 feet MSL, so an absent boundary up high doesn't mean the requirement is gone.
Four checks in a fixed order
- Read the maximum elevation figure in each grid cell along the route. These are printed in hundreds of feet, so a cell marked 41 means 4,100 feet. It's a warning about the worst thing in that block, not a cruise altitude.
- Inspect every obstruction symbol and its height. Charted obstruction elevations are referenced to mean sea level unless the chart says otherwise, and a tower close to your line matters more than a ridge twenty miles off it.
- Compare the highest value you found with your planned cruise altitude. Terrain clearance, airspace and cloud clearance all have to agree, and they usually don't agree by accident.
- Verify the highest obstacle and the airspace floor and ceiling independently. A second look catches the misread symbol, the cell you skipped and the shelf you assumed was higher.
Picture a route that crosses a cell marked 4,100 feet, with a tower charted at 2,800 feet a couple of miles from the line. Planning 4,500 feet leaves margin over both. Planning 4,200 feet leaves the terrain figure sitting right under you with nothing to spare, and that's before weather or a forced deviation.
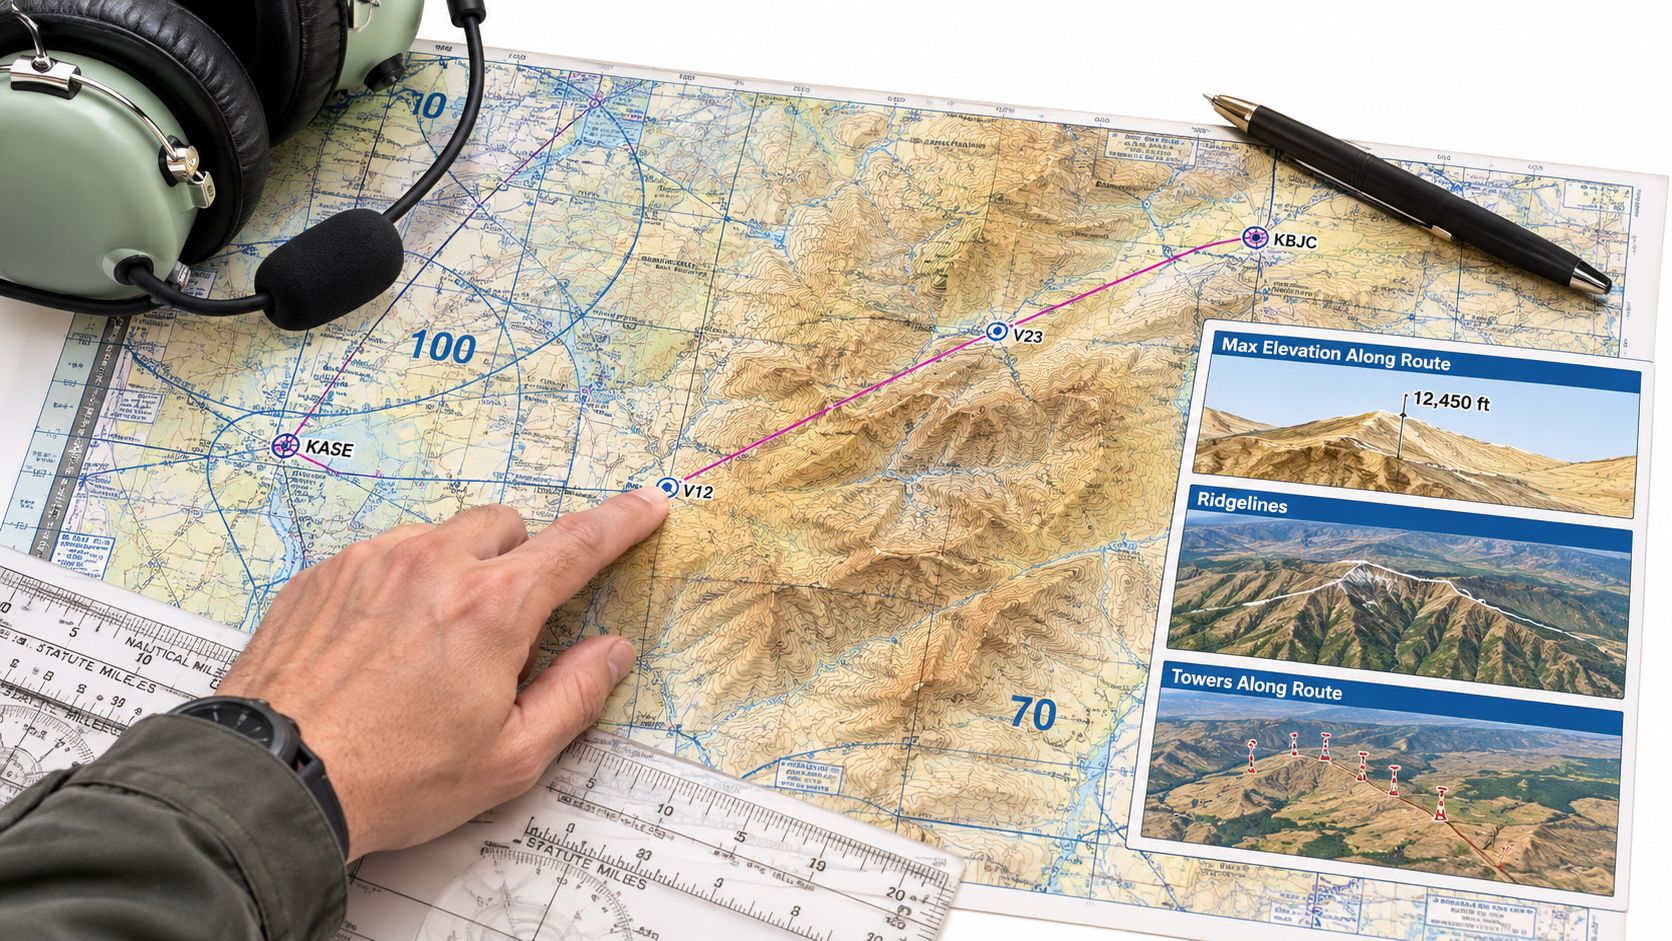
The classic error here is mixing MSL elevations with height above ground. A tower's charted number is its elevation above sea level, not how far above the surface it pokes, and the difference is exactly what determines whether your altitude clears it.
Two more items belong on this pass. Find the isogonic line nearest your route and apply the charted magnetic variation when you convert a true course to a magnetic course, rather than estimating by eye. Then identify each navaid you'll use: a VOR or VORTAC compass rose shows the station, its frequency and its magnetic radials, and you measure the radial from the center of the rose, never from a nearby airport symbol.
Practice Reading Charts Before Your Written Exam
Finish by running the method on a chart you have never flown, because familiarity with one route hides the skill you're testing. Pick a current sectional and a route with at least three checkpoints.
- Complete the five passes in order without jumping ahead to the airports you recognize.
- Annotate each segment with the airspace it enters and the altitude that clears the ground beneath it.
- Measure one leg with a plotter and compare it to the GPS distance, using 6.86 nautical miles per inch as your check.
- Name the maximum elevation figure in each cell you cross and the tallest obstruction within a few miles of the line, then state whether your altitude clears both.
- Record the chart edition date and one Chart Supplement or NOTAM item you verified. If you can't name one, you skipped the currency audit.
When an answer comes out wrong, note which layer you skipped rather than which number you missed. The missed layer is the habit that will follow you into the airplane, and the wrong number is just a symptom of it.
Time the routine. A workable target is finishing the five passes and the currency check while opening the legend no more than twice, because the goal is a repeatable sweep rather than a research project. Our written-exam practice covers sectionals alongside airspace, navigation, VOR and GPS and airport operations, and the practice exams use the same layout as the PSI screen, the official system at every FAA testing center, so the format on exam day won't be a surprise. If you want the broader study plan those questions sit inside, start with our PPL study guide.
This week, choose one route on a current sectional, measure it, read every boundary and obstruction along it, and write the altitude down only after you've confirmed the edition.
Reading a sectional well comes down to two habits that no symbol chart can teach: a fixed reading order and a currency check you run before you trust the page. flyCowboys builds written-test prep around both, with sectionals, airspace, navigation and airport operations questions carrying a plain-English explanation for every single one. The practice exams mirror the PSI screen layout you'll meet at the testing center, so you spend your attention on the chart instead of the interface. Visit flyCowboys and turn one route a week into a repeatable sweep.