· 18 min read
Aviation Weather Theory Explained for Student Pilots
Master aviation weather theory with clear explanations of pressure systems, fronts, icing, lift, clouds, and METAR/TAF interpretation built for student pilots.
You're standing beside the training airplane on a gray morning, holding a printed TAF and wondering whether the forecast is good enough to go. The ceiling looks lower than you expected, the wind has changed since yesterday, and your planned cross-country route passes near a front. You can legally launch, but you're not yet sure you should.
That uncertainty is the core subject of aviation weather theory. Weather isn't just a collection of reports to decode for the FAA written exam. It's a chain of reasoning that helps you decide whether the flight should begin, continue, change altitude, divert, or stop. Pressure, stability, fronts, clouds, METARs, TAFs, icing, and turbulence all matter because they improve that decision.
Table of Contents
- Why Pilots Learn Weather Before Anything Else
- Pressure, Density, and the Atmosphere You Fly Through
- Lift, Stability, and How Clouds Form
- Fronts and Pressure Systems at a Glance
- Icing and Turbulence as In-Flight Threats
- Reading METARs and TAFs Like a Pre-Flight Brief
- When the Forecast Conflicts With What You See
- Putting It All Together on Preflight
Why Pilots Learn Weather Before Anything Else
A student pilot can be ready for the airplane itself and still face the hardest decision before engine start. The forecast is marginal, the route crosses changing conditions, and the legal answer does not clearly settle the practical one. The question is whether the available evidence supports this flight, with enough margin for the forecast to be wrong.
Steep turns, radio calls, and emergency procedures all matter. Weather judgment determines whether you get a safe opportunity to use them. A forecast is evidence, not permission, and one product rarely describes the entire flight.
An instructor asks more than, “What does the METAR or TAF say?” The better questions are: What pattern do the reports, forecasts, and observations form? How confident am I in that interpretation? If conditions deteriorate, what choices remain?
That judgment has a direct connection to operational safety. NOAA reports that weather contributes to approximately 25% to 50% of aviation accidents each year, while weather-related aviation delays in the United States create estimated economic losses exceeding $1 billion annually. These figures are summarized in NOAA's history of aviation weather forecasting.
Weather theory is a decision system
The system supporting those decisions grew with aviation. In 1918, the U.S. Weather Bureau began issuing forecasts for military flights and air-mail routes, including its first aviation forecast for the New York to Chicago Aerial Mail Service route on December 1, 1918. The Air Commerce Act later directed the bureau to provide aviation weather reports, forecasts, and warnings on May 20, 1926.
The practical lesson is simple: weather products exist to support choices. Memorizing symbols and definitions matters only when it improves the choice to depart, delay, change the route, alter altitude, divert, or cancel.
Practical rule: A legal flight is not automatically a wise flight. Personal minimums should generally exceed legal minimums, and the FAA recommends reviewing them at least annually as your experience, training, certification, and aircraft change, according to the FAA Personal Weather Risk Assessment Guide.
Each part of aviation weather theory supplies a different piece of that decision:
- Atmospheric structure explains pressure, density, wind, and aircraft performance.
- Stability and cloud formation indicate where lift, turbulence, and precipitation may develop.
- Fronts and pressure systems show how broad weather patterns move and change.
- Icing and turbulence theory identifies hazards that may exceed aircraft capability.
- METARs and TAFs provide observations and forecasts for a particular place and time.
- Risk assessment compares those imperfect products with what you see, hear, and expect along the route.
The FAA tests weather heavily because this knowledge appears in real preflight decisions. Your task is not perfect atmospheric prediction. It is recognizing when uncertainty has become too large for the flight you planned.
Pressure, Density, and the Atmosphere You Fly Through
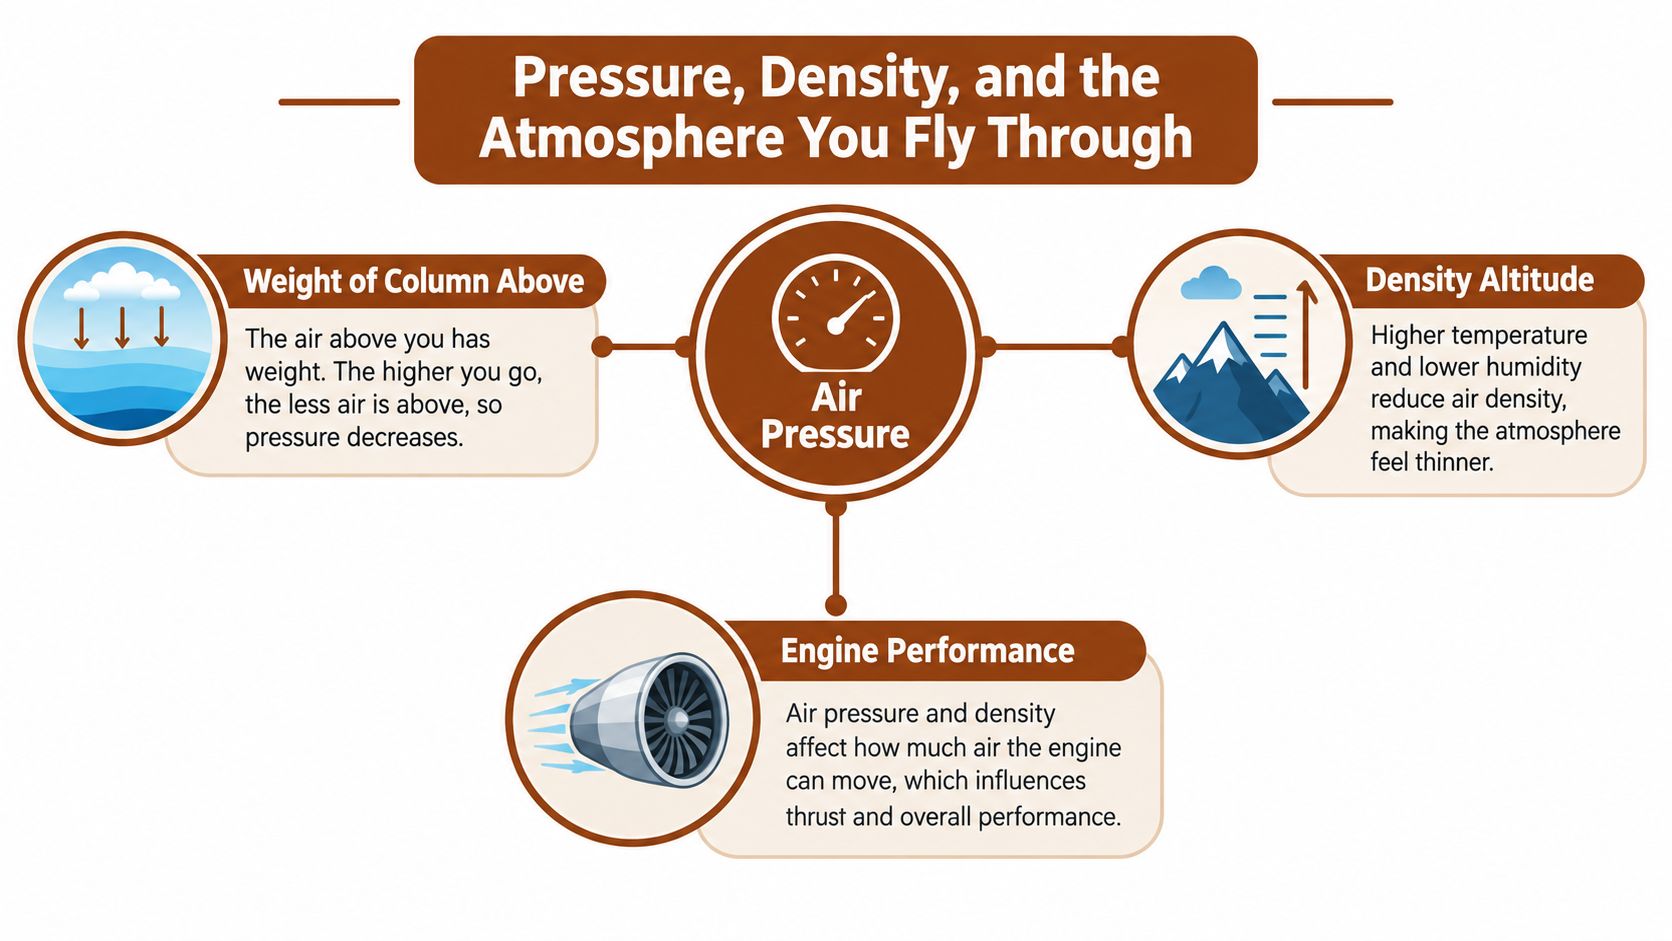
Air pressure is the weight of the atmosphere pressing down on a surface. At sea level, a taller column of air sits above you than it does at a mountain airport, so the pressure is generally greater. As altitude increases, the column becomes shorter and pressure decreases.
Density is related but not identical. It describes how much air occupies a given volume. Temperature, pressure, and moisture all affect density, and the engine, propeller, and wings respond to the air's density rather than to pressure alone.
A useful analogy is an elevator in a building. Pressure altitude tells you which floor you're on relative to a standard reference. Density altitude tells you how crowded or thin the air feels at that floor. A hot day, high airport, or humid atmosphere can make the airplane perform as though it's operating at a higher altitude than the field elevation suggests.
Why the standard atmosphere appears everywhere
The International Standard Atmosphere, or ISA, gives pilots and engineers a common reference. Altimeters, performance charts, and many forecast products need a standard baseline so everyone can compare conditions consistently. That's why 29.92 inches of mercury and 15°C appear so often in training material and performance calculations.
The atmosphere also changes temperature with height. Three lapse rates matter:
- Environmental lapse rate: The actual temperature change in the surrounding atmosphere.
- Dry adiabatic lapse rate: The cooling rate of a rising unsaturated parcel of air.
- Saturated adiabatic lapse rate: The cooling rate of a rising saturated parcel, which differs because condensation releases heat.
Their relationship determines stability. A parcel that remains warmer than its surroundings keeps rising. A parcel that becomes cooler returns toward its original level. That simple comparison explains much of the difference between towering cumulus and widespread stratus.
Pressure patterns and wind
A high is an area of relatively higher pressure, while a low is an area of relatively lower pressure. A ridge is an elongated area of higher pressure, and a trough is an elongated area of lower pressure. Air tends to move from high pressure toward low pressure, but Earth's rotation bends that flow through the Coriolis effect.
On a surface analysis chart, isobars connect points of equal pressure. Think of them as elevation contours on a topographic map, except the contours represent pressure rather than terrain. Closely spaced isobars indicate a stronger pressure gradient and usually stronger wind.
You can reinforce unfamiliar terms with the FlyCowboys aviation glossary, but don't stop at definitions. Ask what each feature means for your route, runway, climb performance, and available escape options.
Lift, Stability, and How Clouds Form
Clouds begin with air that rises, cools, and reaches saturation. The difficult part for students is remembering that air doesn't rise for only one reason. Four lifting mechanisms appear repeatedly in aviation weather theory.
Convective lifting occurs when the surface heats air from below. The warmer parcel rises, which can produce cumulus clouds and strong vertical currents. Orographic lifting happens when wind pushes air up a mountain or ridge. Frontal lifting occurs when one air mass is forced over another. Convergence develops when air flows together near the surface and has to move upward.
Stability determines what happens after the parcel starts moving. In unstable air, a rising parcel remains warmer and less dense than its surroundings, so it continues upward. That environment supports cumuliform clouds, showers, turbulence, and rapid vertical development. In stable air, a displaced parcel tends to return toward its original level, favoring stratiform clouds, smoother air, and broad layers of cloud or precipitation.
Cloud families as clues
The ten primary cloud types are easier to remember when grouped by height and shape rather than memorized as isolated names.
- Low clouds: Stratus, stratocumulus, and cumulus.
- Middle clouds: Altostratus, altocumulus, and nimbostratus.
- High clouds: Cirrus, cirrostratus, and cirrocumulus.
- Vertical clouds: Cumulus and cumulonimbus.
The names provide clues. “Stratus” suggests a layer, while “cumulus” suggests a heap or vertical build-up. “Nimbus” signals precipitation. A cumulonimbus, commonly called a thunderstorm or CB, combines deep vertical development with serious hazards.
| Cloud Family | Stability Signal | Flying Implication |
|---|---|---|
| Low stratus | Stable, layered air | Reduced ceilings and visibility, possible smooth IMC and icing |
| Low cumulus | Unstable or locally convective air | Bumps, showers, changing tops and bases |
| Middle altostratus | Broad lifting and saturation | Widespread cloud, precipitation, and possible icing |
| Middle altocumulus | Variable stability | Turbulence or developing convection when towering |
| High cirrus | Moisture aloft, often ahead of systems | Early indication of an approaching change, usually limited immediate turbulence |
| Vertical cumulonimbus | Strong instability | Severe turbulence, hail, lightning, icing, wind shear, and downdrafts |
A stratus deck can look less dramatic than a line of thunderstorms, but its operational meaning still depends on ceiling, visibility, temperature, and escape options. Towering cumulus demands attention because it may grow into a convective cell while you're still planning the departure.
Cloud type, base, tops, and movement should never be treated as decoration. They help you connect the atmosphere to the METAR, TAF, radar picture, and go/no-go decision.
Fronts and Pressure Systems at a Glance
A front is a boundary between air masses with different characteristics, especially temperature and moisture. The front itself isn't a wall. It's a zone where the atmosphere changes, and the change can affect wind, clouds, visibility, precipitation, and turbulence.
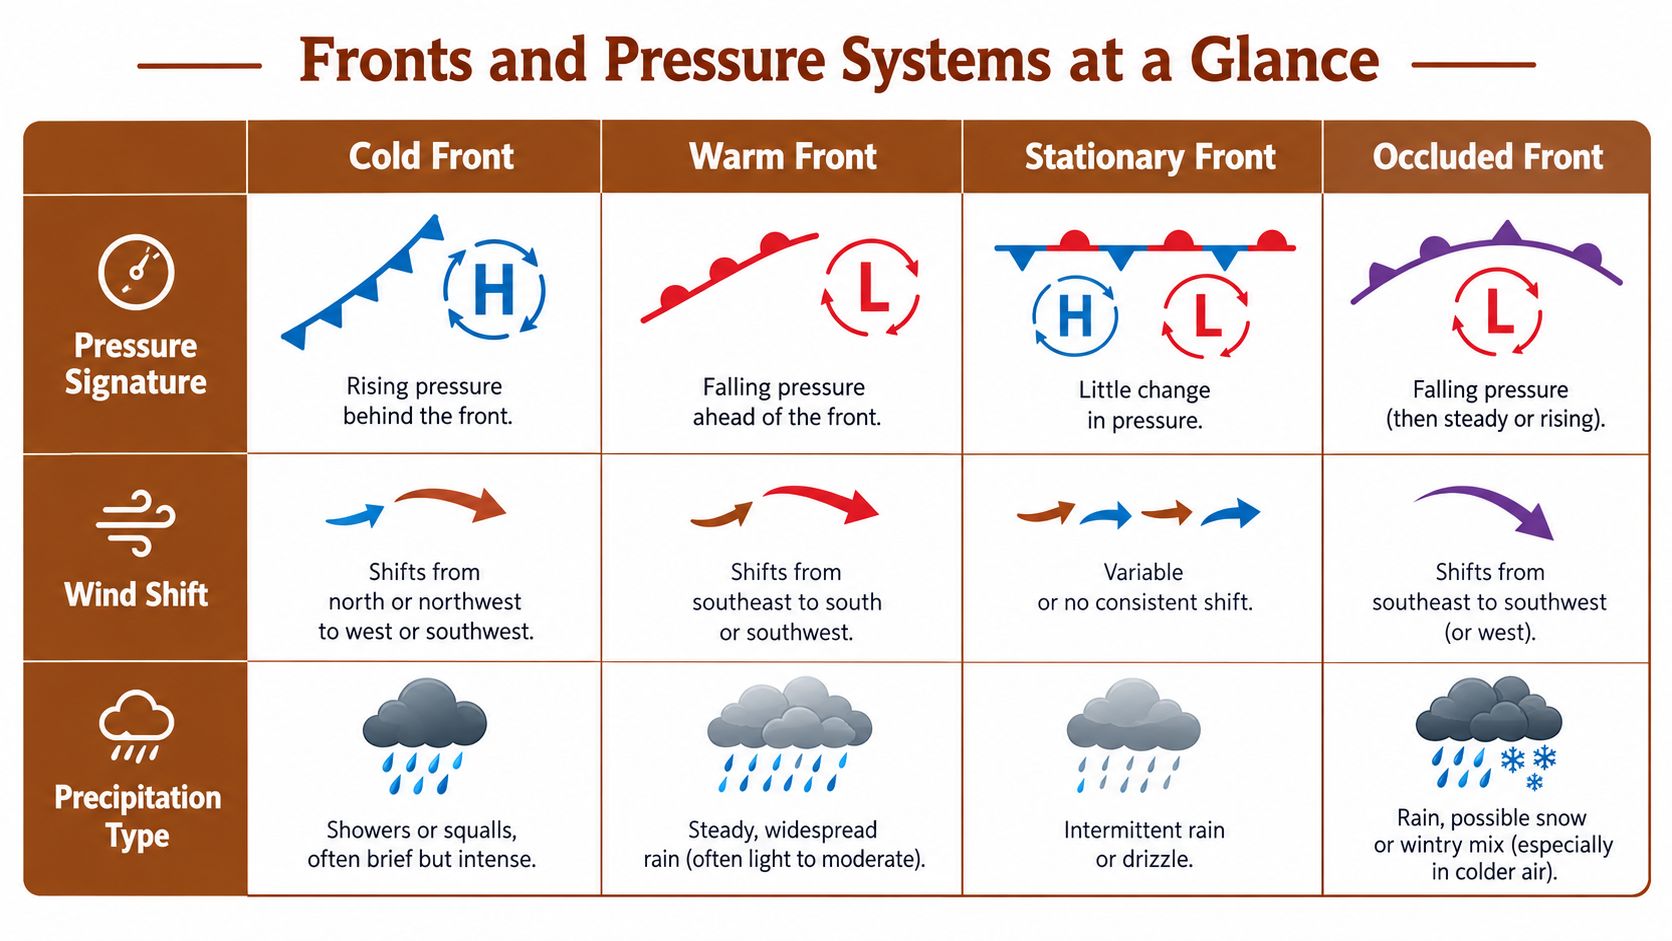
A cold front develops when colder air advances and lifts warmer air. The slope is relatively steep, so lifting can be vigorous. Expect a sharper wind shift, rapidly changing conditions, showers, and possible thunderstorms when moisture and instability support convection.
A warm front forms when warmer air advances over retreating colder air. The warm air rises gradually over a broad area, which favors layered cloud, steady precipitation, reduced visibility, and widespread icing potential when temperatures support freezing.
A stationary front has little movement because neither air mass displaces the other. Its weather can linger, making improvement difficult to time. An occluded front forms when a faster-moving cold front catches a warm front, combining characteristics of both systems and often producing complex cloud and precipitation patterns.
Reading the chart as a story
Start with the low-pressure center, then trace the fronts outward. Look for the direction of movement, the pressure tendency, and the spacing of isobars. A tightly packed pattern suggests stronger winds, while a front near abundant moisture and unstable air deserves more caution than the same symbol in a dry, stable environment.
| Front Type | Pressure Signature | Wind Shift | Precipitation Type |
|---|---|---|---|
| Cold front | Often near a low and pressure rise after passage | Abrupt shift, commonly toward colder air | Showers, thunderstorms, or a narrow band of precipitation |
| Warm front | Ahead of a low, with broad lifting | Gradual change as warmer air arrives | Widespread steady rain, drizzle, or snow |
| Stationary front | Boundary remains nearly fixed | Limited net shift | Persistent cloud, precipitation, and reduced visibility |
| Occluded front | Mature low with merged boundaries | Complex shift around the low | Mixed cloud and precipitation patterns |
Don't use the chart as a substitute for current observations. Compare its forecast position with radar, satellite, METAR trends, and pilot reports. If the front is arriving earlier than expected, your original departure window may no longer exist.
Icing and Turbulence as In-Flight Threats
Structural icing requires two conditions at the same time: visible liquid water and a temperature environment that allows freezing on the aircraft. Cloud droplets or rain can remain liquid below 0°C in a supercooled state, then freeze when they strike the wing, tail, propeller, or other surface.
The FAA identifies approximately +2°C to −10°C in visible precipitation as a particularly important icing range, based on FAA Advisory Circular AC 00-6B. That range isn't a permission band. It's a reason to treat visible moisture as a serious threat, especially near fronts and in clouds with large supercooled droplets.
Rime ice generally develops from smaller droplets and tends to form a rough, opaque deposit. Clear ice can form from larger droplets that spread before freezing, creating a hard, irregular shape. Mixed ice combines characteristics of both. In every case, the aerodynamic result matters more than the appearance. Ice increases drag, reduces lift, and can degrade propeller or engine performance.
Turbulence has different causes
Mechanical turbulence develops when wind flows over buildings, trees, or uneven terrain. Mountain waves can create strong vertical currents and turbulence downwind of ridges. Convective turbulence comes from the powerful updrafts and downdrafts inside unstable clouds.
Thunderstorms combine several hazards at once. The FAA describes turbulence as present in all thunderstorms, with severe or extreme turbulence common. Its guidance also warns that severe turbulence can extend as far as 20 miles from a severe thunderstorm, while the distance is about 10 miles for less severe storms, as explained in FAA guidance on hazardous weather.
Avoidance rule: Don't attempt to penetrate a thunderstorm or thread between cells based only on a visual gap. Build lateral and temporal separation, monitor updates and PIREPs, and divert before the route closes.
Before flight, ask:
- Moisture: Will the route put the aircraft in visible precipitation?
- Temperature: Are freezing levels and above-freezing layers known?
- Aircraft capability: Is the aircraft certified and equipped for the expected icing environment?
- Turbulence: Are terrain, fronts, thunderstorms, or strong winds creating a rough-air threat?
- Escape: Can you exit or divert before performance margins deteriorate?
Pitot heat and applicable carburetor or engine anti-ice systems must be used according to aircraft procedures. In an aircraft not certified for known icing, continued exposure isn't a problem to solve with optimism. It's a condition to leave promptly.
Reading METARs and TAFs Like a Pre-Flight Brief
A METAR is an observation of current or recent conditions. A TAF is a forecast for an airport and its surrounding area over a stated validity period. Reading them together creates a timeline. Reading either one alone can hide the trend that matters most.
Consider a simplified METAR:
KABC 121655Z 24012G18KT 5SM -RA BKN012 OVC025 08/07 A2992
Start with KABC, the station identifier. 121655Z means the observation was issued on the twelfth day of the month at 1655 UTC. 24012G18KT gives wind from 240 degrees at 12 knots, gusting to 18. 5SM is visibility of five statute miles, followed by light rain.
BKN012 means broken clouds at 1,200 feet above ground level. Because broken counts as a ceiling, this is a ceiling concern. OVC025 adds an overcast layer at 2,500 feet. 08/07 gives temperature and dewpoint in Celsius, while A2992 gives an altimeter setting of 29.92 inches of mercury.
Decode the forecast as a change
A simplified TAF might read:
KABC 121130Z 1212/1312 22010KT P6SM SCT020 BKN040 TEMPO 1218/1222 3SM TSRA BKN015CB
The first group identifies the airport and issue time. The validity group tells you the forecast window. Wind and visibility describe the expected baseline, while SCT020 and BKN040 describe scattered clouds at 2,000 feet and a broken layer at 4,000 feet.
The TEMPO group is the warning hidden inside an otherwise comfortable forecast. During the stated period, thunderstorms, reduced visibility, a lower ceiling, and cumulonimbus clouds may occur. A student planning a cross-country during that window should ask whether the route has enough flexibility to tolerate that change.
| Code | Meaning |
|---|---|
KT |
Wind speed in knots |
G |
Gust |
SM |
Statute miles of visibility |
RA |
Rain |
BR |
Mist |
FG |
Fog |
SCT |
Scattered cloud layer |
BKN |
Broken cloud layer, a ceiling |
OVC |
Overcast cloud layer, a ceiling |
CB |
Cumulonimbus |
TEMPO |
Temporary conditions during the stated period |
FM |
From a specified time, a new forecast condition begins |
Use a printed decoding reference or an integrated private pilot ACS guide while studying, but keep the operational question in view: What will the weather be when I depart, along the route, and when I return?
Compare the latest METAR with the TAF's baseline and temporary groups. If the observation is already worse than forecast, or the trend is moving toward the temporary group, don't split the difference. Treat the mismatch as new information and reassess the flight.
When the Forecast Conflicts With What You See
You arrive for a planned departure and find the ceiling still low, although the TAF promised improvement. The decision is not whether the forecast or the observation is “right.” It is whether the weather you can verify now supports the flight you intend to make.
Forecast confidence is never forecast certainty. Nowcasting, ensemble guidance, and machine-learning tools can reveal useful patterns, but current observations, warnings, trends, and escape options should guide the go/no-go choice. The World Meteorological Organization reports that deep-learning methods using satellite data have extended warning lead times for some hazards to 6 to 8 hours. Its aviation discussion also emphasizes validation and more frequent updates, as described by the WMO aviation weather overview.
| Scenario | Forecast Said | Pilot Saw | Decision |
|---|---|---|---|
| Marine layer persists | VFR improvement expected | Ceiling remains low and stable | Delay or choose a different plan. Do not launch because improvement is overdue |
| Convective pop-up | Model shows limited activity | Towering cumulus and nearby lightning develop | Avoid the area, obtain updates, and preserve a diversion option |
| Front arrives early | Passage expected later | Wind shifts, pressure changes, and precipitation begin ahead of schedule | Treat the observed passage as current and reassess the route |
A model may miss a rapidly developing thunderstorm when its grid, update cycle, or initialization fails to represent a local change. A detailed graphic can look precise while still placing the threatening cell incorrectly relative to your runway.
The same caution applies to AI-based forecasts. ECMWF's AI Forecasting System became operational in 2025 and provides deterministic and ensemble products extending to 15 days, according to ECMWF's AIFS documentation. Those capabilities do not remove uncertainty, product limitations, or delays between updates.
When forecasts conflict, do not average them into a comfortable answer. Give current observations, warnings, trends, and escape options more weight than an attractive model image.
Write the decision in plain language. Record what the forecast expected, what the atmosphere is doing now, and which condition would change your plan. That habit turns uncertainty into a controlled choice rather than a last-minute surprise.
Putting It All Together on Preflight
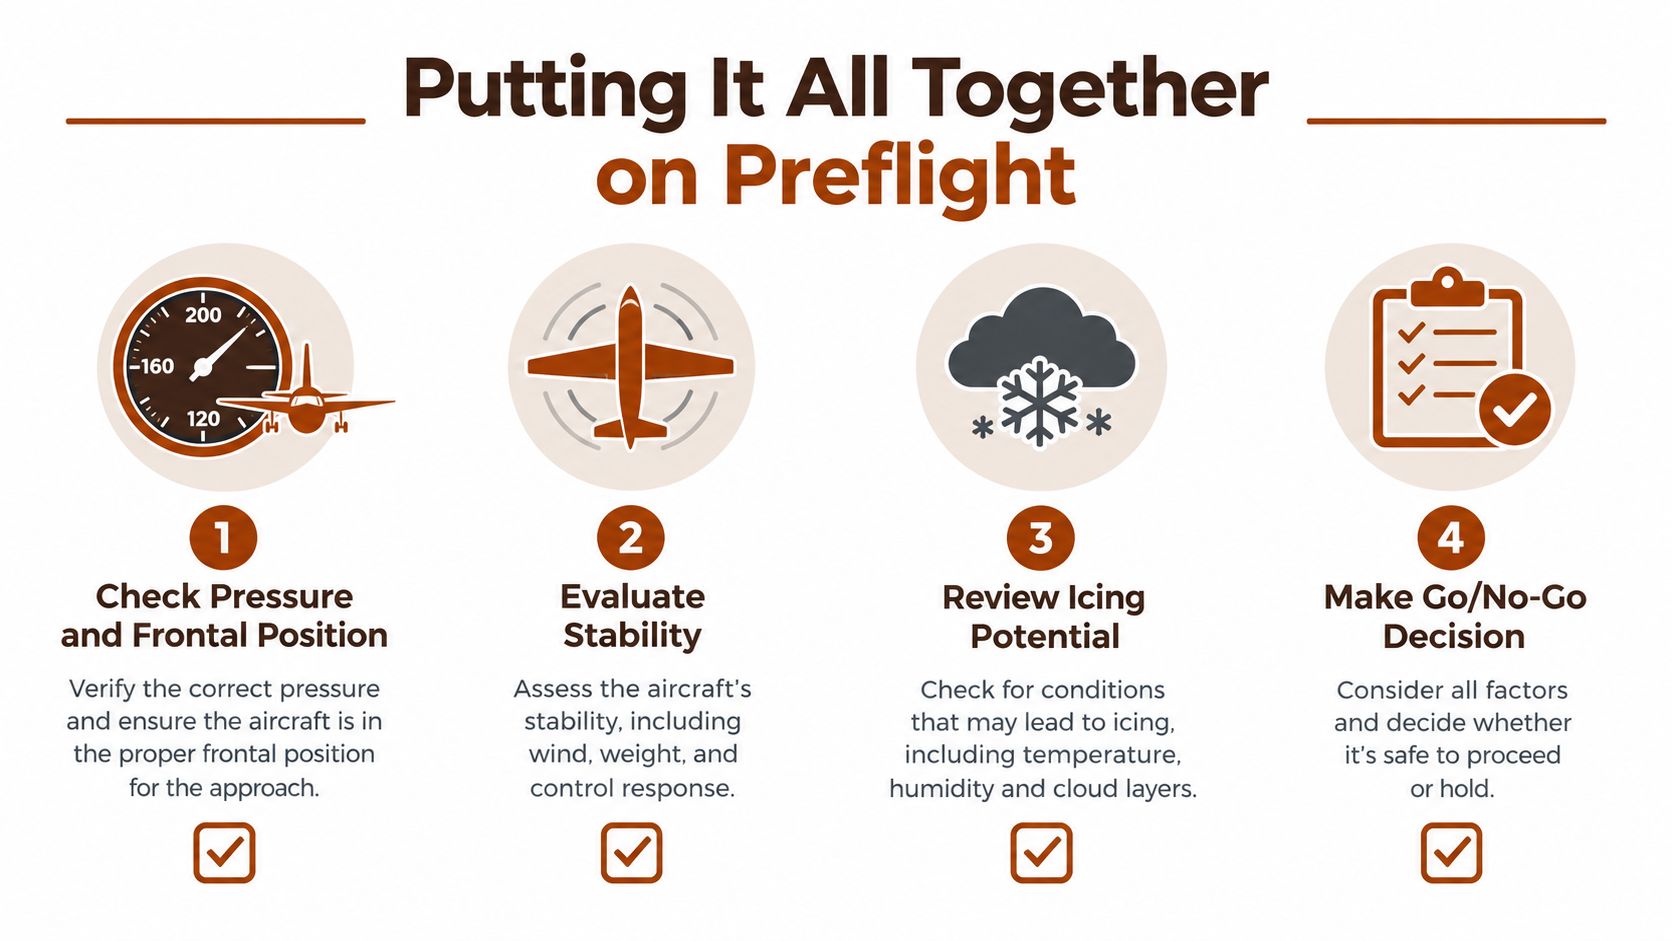
Weather theory becomes useful when you run it as a repeatable decision process. Start with the large-scale picture, then move toward the aircraft and the exact flight.
- Check pressure and frontal position. Identify nearby highs, lows, ridges, troughs, and fronts. Ask what wind shift, precipitation, or visibility change may reach the route.
- Evaluate stability. Use cloud type, vertical development, temperature, dewpoint, and terrain to judge whether the air favors smooth layers or growing convection.
- Review icing and turbulence potential. Compare moisture and temperature with the aircraft's limitations. Look for thunderstorms, mountain waves, strong surface winds, and reports from pilots already flying.
- Make the go/no-go decision. Reconcile the TAF with the latest METAR, radar, satellite, warnings, and observed trend. Set a departure limit, an en route escape plan, and a point where you'll divert or return.
The flyCowboys PPL study guide can support FAA knowledge preparation for weather theory, reports, and related ACS areas. Use it alongside your instructor's briefing habits and current official weather products, not as a replacement for either.
A good weather decision doesn't require perfect confidence. It requires enough understanding to recognize the hazards, enough humility to respect forecast error, and enough discipline to stay on the ground when the available evidence doesn't support the flight.
flyCowboys offers FAA written-exam preparation with adaptive question practice, plain-English explanations, ACS-aligned weather content, AI radio drills, and a flight logbook in one iPhone app subscription. Use it to strengthen your understanding of pressure, stability, METARs, TAFs, and operational risk, then visit flyCowboys to explore the study tools.